You buy a promising new token at launch. The price rockets 300% in two weeks. Then it crashes 80% in three days. You check the blockchain explorer and discover the team just unlocked 40% of the total supply. They sold everything.
This scenario plays out constantly in crypto markets. The token distribution impact investment returns more than most investors realize. How tokens get allocated, when they unlock, and who controls them can make or break your portfolio.
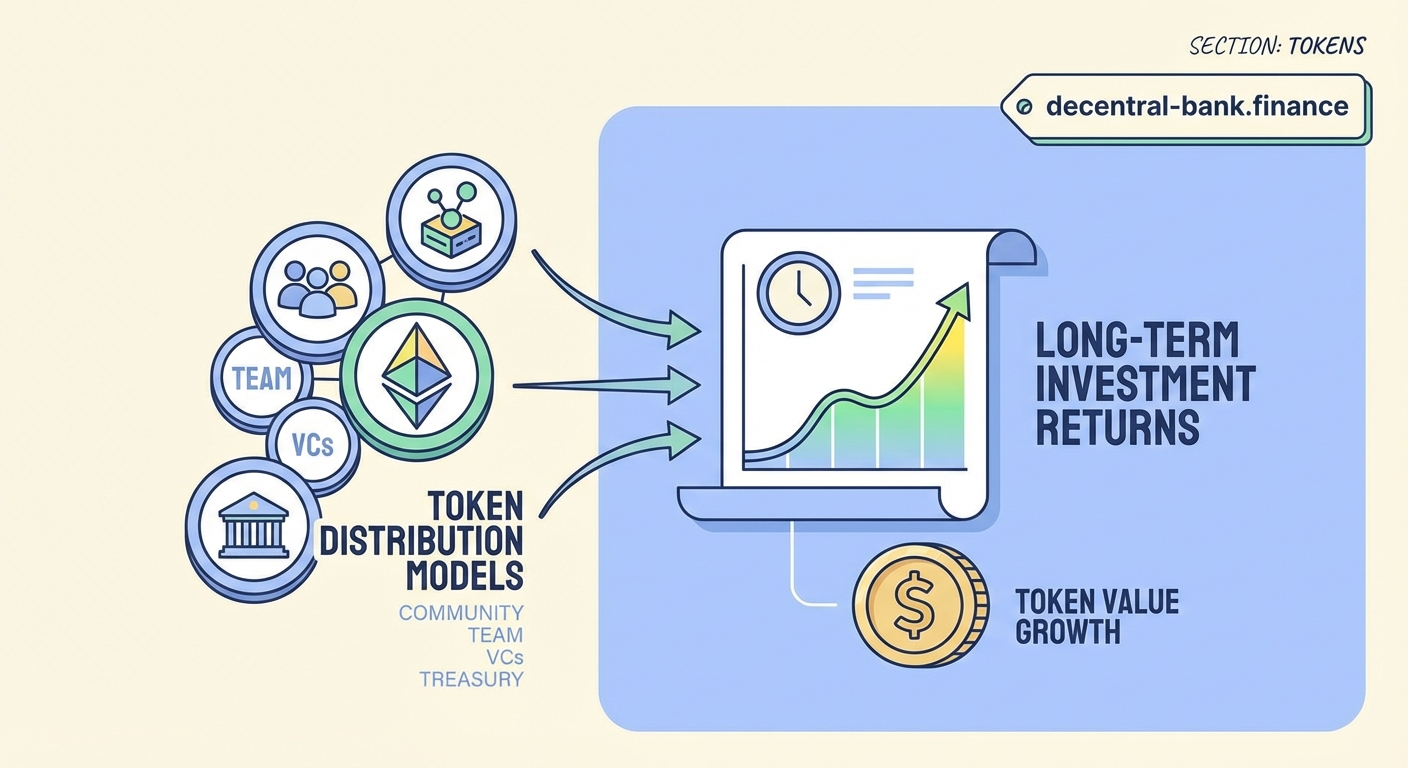
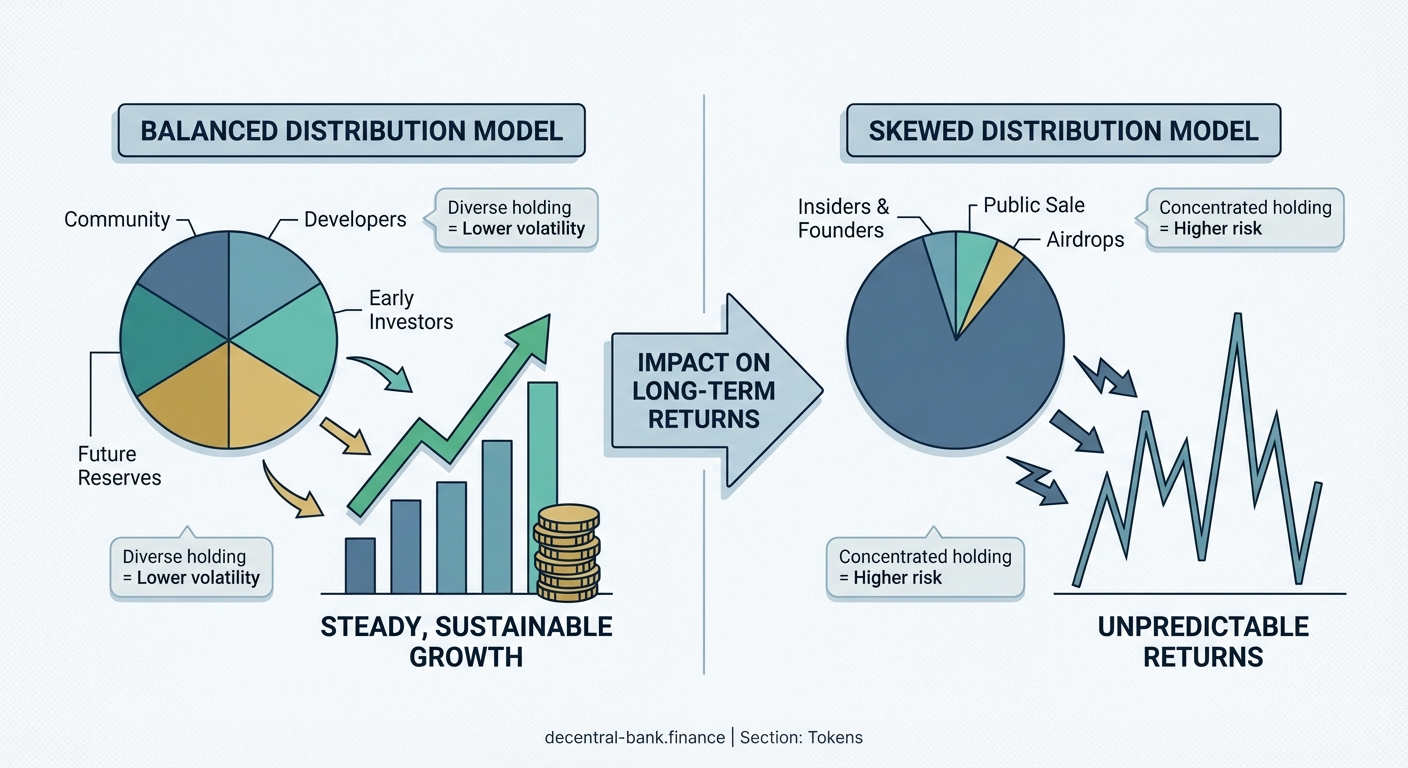
Token distribution models directly determine your investment returns through supply dynamics, selling pressure, and price stability. Projects with fair allocations, gradual vesting schedules, and transparent emission rates typically outperform those with concentrated holdings and sudden unlocks. Understanding distribution mechanics helps you avoid value extraction schemes and identify sustainable tokenomics that support long-term growth.
Why distribution models matter more than market cap
Most investors focus on price charts and market capitalization. They miss the fundamental driver behind both metrics.
Token distribution determines who holds what percentage of supply. It controls when those tokens become liquid. It shapes every incentive in the ecosystem.
A project might show a $500 million market cap. But if 70% of tokens remain locked with insiders, the real circulating value is $150 million. The actual float available for trading is tiny. One large holder can move the entire market.
Distribution also reveals alignment. When teams vest tokens over four years, they commit to building long term. When they unlock everything at launch, they signal different priorities.
The structure of token allocation creates the economic reality you invest in. Everything else is just narrative.
Core distribution models and their risk profiles
Different projects use different allocation strategies. Each model creates distinct investment dynamics.
Fair launch models distribute tokens through mining, staking, or liquidity provision. No pre-mine exists. No venture capital allocation. Everyone starts equal.
These models attract decentralization advocates. They avoid concentration risk from large holders. But they also lack funding for development and marketing. Many fair launch projects struggle to compete with well-funded alternatives.
Venture-backed models allocate 20% to 40% of supply to early investors and team members. These tokens typically vest over two to four years with a six to twelve month cliff.
This model provides capital for growth. It attracts experienced teams. But it creates future selling pressure. When vesting periods end, early investors often take profits. The how to identify utility tokens vs security tokens before investing framework helps evaluate these structures.
Community-first models reserve 60% to 80% of supply for users, liquidity providers, and ecosystem participants. Teams and investors receive smaller allocations with longer vesting.
These projects prioritize decentralization and user ownership. They build stronger communities. But they sometimes lack resources for professional development and partnerships.
Hybrid models combine elements from multiple approaches. They balance funding needs with community distribution. Most successful projects in 2024 use some form of hybrid structure.
The three phases of token distribution
Token distribution unfolds across distinct timeframes. Each phase creates different market dynamics.
Initial allocation phase
This covers the first six to twelve months after launch. Circulating supply is typically 5% to 20% of total supply. Price volatility runs high. Small buy or sell orders move markets significantly.
Projects with strong initial distribution to active users tend to perform better. Tokens in the hands of people who use the protocol create organic demand. Tokens held by speculators create volatility.
Vesting unlock phase
This spans months 12 to 48 for most projects. Team tokens, investor tokens, and ecosystem reserves gradually unlock according to predetermined schedules.
This phase creates predictable selling pressure. Smart investors track unlock calendars. They reduce positions before major unlocks. They accumulate after unlocks when prices dip.
Projects that communicate unlock schedules transparently maintain better price stability. Those that hide vesting details face sharper corrections when unlocks occur.
Mature distribution phase
After year four, most tokens have fully vested. Circulating supply approaches maximum supply. Distribution becomes more decentralized as early holders sell to new participants.
Mature projects with healthy distribution show thousands of holders with no single entity controlling more than 5% of supply. Unhealthy projects remain concentrated among a few wallets even years after launch.
How to evaluate a project’s distribution model
Before investing, analyze these specific elements of token distribution.
-
Check the allocation percentages. Review what percentage goes to team, investors, treasury, and community. Red flags appear when team plus investors exceed 40% of total supply.
-
Examine vesting schedules in detail. Look for cliff periods and linear vesting. Avoid projects where large portions unlock simultaneously. Gradual releases over 36 to 48 months indicate better alignment.
-
Calculate real circulating supply. Subtract all locked, vested, and treasury tokens from total supply. Compare this figure to reported market cap. Many projects inflate their apparent value by reporting fully diluted valuations.
-
Identify the largest holders. Use blockchain explorers to find the top 20 addresses. Calculate what percentage they control. Exclude known exchange wallets and protocol contracts. If 10 addresses hold more than 50% of circulating supply, concentration risk is severe.
-
Track historical unlock events. Research how price performed during previous vesting unlocks. Projects that maintain stability through unlocks demonstrate strong fundamental demand.
-
Verify distribution transparency. Check if the project publishes clear documentation about allocations, vesting, and unlocks. Opacity suggests potential problems.
Distribution red flags that predict poor returns
Certain patterns in token distribution consistently correlate with underperformance.
- Massive team allocations. When founders control more than 20% of supply, they have overwhelming power to influence price.
- Short vesting periods. Anything less than 24 months suggests misaligned incentives.
- No vesting cliffs. Immediate liquidity for insiders creates instant selling pressure.
- Hidden allocations. Undisclosed token holdings that appear after launch indicate deception.
- Unclear emission schedules. Projects that can’t explain their inflation rate lack basic economic planning.
- Concentrated liquidity provider tokens. When a single address provides 80% of liquidity, they can rug pull at any time.
The how to spot a rug pull before you lose your crypto guide covers additional warning signs related to distribution manipulation.
Comparing distribution strategies across project types
Different types of crypto projects require different distribution approaches.
| Project Type | Typical Community Allocation | Typical Team/Investor Allocation | Vesting Period | Distribution Priority |
|---|---|---|---|---|
| DeFi Protocol | 60-70% | 30-40% | 3-4 years | Liquidity providers and users |
| Layer 1 Blockchain | 50-60% | 40-50% | 4-5 years | Validators and developers |
| Gaming Token | 70-80% | 20-30% | 2-3 years | Players and content creators |
| Governance Token | 65-75% | 25-35% | 3-4 years | Active governance participants |
| Meme Coin | 90-100% | 0-10% | 0-1 year | Community members |
These benchmarks help you evaluate whether a project’s distribution aligns with its category. A DeFi protocol that allocates only 30% to users raises questions about its commitment to decentralization.
Emission rates and inflation dynamics
Token distribution extends beyond initial allocation. Ongoing emission creates new supply that affects your returns.
Some projects mint new tokens to reward stakers, liquidity providers, or validators. This inflation dilutes existing holders unless the protocol generates enough demand to absorb new supply.
Calculate annual emission rate by dividing new tokens created per year by current circulating supply. Emission rates above 10% per year create significant headwinds for price appreciation.
Projects with decreasing emission schedules perform better long term. Bitcoin’s halving cycle demonstrates this principle. Emission cuts in half every four years, creating supply shocks that drive price increases.
The how to start staking crypto: a complete beginner’s walkthrough resource explains how staking rewards relate to emission dynamics.
Real world distribution case studies
Looking at actual projects reveals how distribution impacts returns.
Uniswap airdropped 15% of total supply to early users in September 2020. Another 43% was allocated to community treasury and liquidity mining. Team and investors received 21% each with four-year vesting.
This distribution created strong community ownership. Users who received the airdrop became stakeholders invested in protocol success. The token maintained relatively stable distribution even as it grew to billions in market cap.
Apecoin allocated 62% to ecosystem fund and community. But the initial unlock schedule released large amounts quickly. Major holders sold during early unlocks, creating price crashes that hurt retail investors.
The project later adjusted emission schedules based on community feedback. This demonstrates that distribution models can evolve, but initial mistakes create lasting damage.
Bitcoin used pure proof of work distribution with no pre-mine. Early miners accumulated significant holdings, but distribution gradually decentralized over 15 years. Today, no single entity controls enough Bitcoin to manipulate the market.
This gradual, merit-based distribution contributed to Bitcoin’s position as the most trusted cryptocurrency.
Building a distribution analysis framework
Create a systematic approach to evaluating token distribution before investing.
Start by gathering primary documents. Read the whitepaper, tokenomics documentation, and vesting schedules. Verify information on the blockchain rather than trusting marketing materials.
Build a spreadsheet tracking monthly unlock events for the next 24 months. Calculate the percentage increase in circulating supply each month. Months with increases above 5% require extra scrutiny.
Monitor holder distribution monthly using blockchain analytics tools. Track whether distribution is becoming more or less concentrated. Increasing concentration suggests accumulation by whales who may dump later.
Compare the project’s distribution to competitors in the same category. Significant deviations from category norms require explanation. Either the project has good reasons for its unique approach, or it’s hiding something.
The best predictor of future token performance is current holder behavior. Watch what large holders do, not what project teams say. If insiders accumulate during unlocks instead of selling, that signals confidence. If they dump immediately, that signals problems.
Distribution models and regulatory considerations
Token distribution increasingly attracts regulatory attention. How tokens get allocated determines whether regulators classify them as securities.
Projects that sell tokens primarily to venture capitalists and institutional investors face higher securities risk. Wide distribution to users who actually use the protocol provides stronger arguments for utility classification.
The how major defi protocols are responding to new regulatory frameworks in 2024 article covers how distribution strategies adapt to regulatory pressure.
Geographic distribution also matters. Projects that restrict token sales in certain jurisdictions show awareness of compliance requirements. Those that sell globally without restrictions may face enforcement actions.
Protecting your portfolio from distribution risks
You can’t eliminate distribution risk, but you can manage it.
Never invest more than 5% of your portfolio in any single token with concentrated distribution. Even if the project looks promising, concentration creates unacceptable risk.
Set calendar reminders for major unlock dates. Review your position size two weeks before significant unlocks. Consider reducing exposure or setting stop losses.
Prioritize projects with transparent distribution and active communication. Teams that regularly update the community about vesting schedules and holder metrics demonstrate respect for investors.
Use how to choose between hot wallets and cold wallets for your crypto strategies to secure tokens you plan to hold long term through unlock periods.
Diversify across different distribution models. Hold some fair launch tokens, some venture-backed tokens, and some community-first tokens. This spreads your exposure across different risk profiles.
Distribution impact on DeFi protocol performance
Token distribution affects DeFi protocols differently than other crypto projects.
DeFi protocols need tokens distributed to users who provide liquidity and use the protocol. Concentrated holdings reduce protocol utility. If a few whales hold most governance tokens, the protocol isn’t truly decentralized.
Projects that reward active participation with token distributions build stronger networks. How does DeFi actually work without banks or middlemen explains the relationship between token distribution and protocol function.
Liquidity mining programs distribute tokens to users who provide capital. Well-designed programs create sustainable liquidity. Poorly designed programs attract mercenary capital that leaves immediately after rewards end.
The how to provide liquidity on uniswap without losing money guide discusses how token incentives affect liquidity provider returns.
Common distribution mistakes that destroy value
Projects repeatedly make the same distribution errors.
Mistake one: Allocating too much to marketing and partnerships. These tokens often get dumped by recipients who received them for free.
Mistake two: Creating complex vesting schedules that confuse investors. Opacity breeds distrust and selling pressure.
Mistake three: Failing to reserve enough for ecosystem development. Projects run out of tokens to incentivize growth and must either inflate supply or watch competitors overtake them.
Mistake four: Not adjusting distribution based on market conditions. Bear markets require different distribution strategies than bull markets.
Mistake five: Treating distribution as a one-time event rather than an ongoing process. Successful projects continuously refine how they distribute tokens to maximize network effects.
How distribution models evolve over time
Token distribution isn’t static. Successful projects adapt their models as they mature.
Early stage projects focus on attracting users and liquidity. They distribute tokens generously to bootstrap network effects. This creates inflation but builds the foundation for future growth.
Mid-stage projects shift toward sustainable emission rates. They’ve built their user base and now focus on retention. Distribution rewards active participants rather than new users.
Mature projects often implement token burns or buybacks to offset emission. They’ve achieved product-market fit and generate revenue. Reducing supply while maintaining or growing demand drives value to holders.
Understanding which stage a project occupies helps you evaluate whether its current distribution model makes sense.
Making distribution analysis part of your research process
Token distribution analysis should be as routine as checking price charts.
Before buying any token, spend 30 minutes researching its distribution. This small time investment can save you from catastrophic losses.
Build a checklist covering allocation percentages, vesting schedules, holder concentration, emission rates, and unlock calendars. Run every potential investment through this checklist.
Follow blockchain analysts who specialize in tokenomics. They often identify distribution red flags before they become obvious to the broader market.
Join project Discord servers and Telegram channels. Community members often discuss distribution concerns that don’t appear in official documentation.
Create a personal database tracking distribution metrics for tokens you own or watch. Update it monthly. This builds pattern recognition that improves your investment decisions.
Turning distribution knowledge into better returns
Understanding token distribution gives you an edge over investors who ignore tokenomics.
You can identify undervalued projects with excellent distribution that haven’t been discovered yet. You can avoid overvalued projects with terrible distribution propped up by marketing.
You can time entries and exits around unlock events. You can size positions appropriately based on concentration risk.
You can participate in governance to influence future distribution decisions. Many projects let token holders vote on emission schedules and allocation changes.
Distribution analysis isn’t glamorous. It requires reading documentation and analyzing blockchain data. But it’s one of the few ways to generate consistent alpha in crypto markets.
The token distribution impact investment returns more than hype, partnerships, or technology. Master distribution analysis, and you’ll outperform most crypto investors.
Start with your current holdings. Review their distribution models today. You might discover risks you didn’t know existed, or opportunities you’ve been overlooking. Either way, you’ll make better decisions going forward.